|

|
|
Uniform Server PHP IDE.
|
PHP CLI
Uniform Server PHP IDE allows you to quickly test PHP CLI scripts. Having an integrated console window the environment is self-contained making it ideal for learning PHP CLI. Debugging CLI scripts requires only a few mouse scripts.
Example on this page uses a very basic CLI script to demonstrate CLI input and output.
The step-by-step guide details all steps required for debugging.
Test Script
Test script input_output.php is located in folder H:\us_ide_1\us_portable_php_ide\php_scripts
Debugging steps
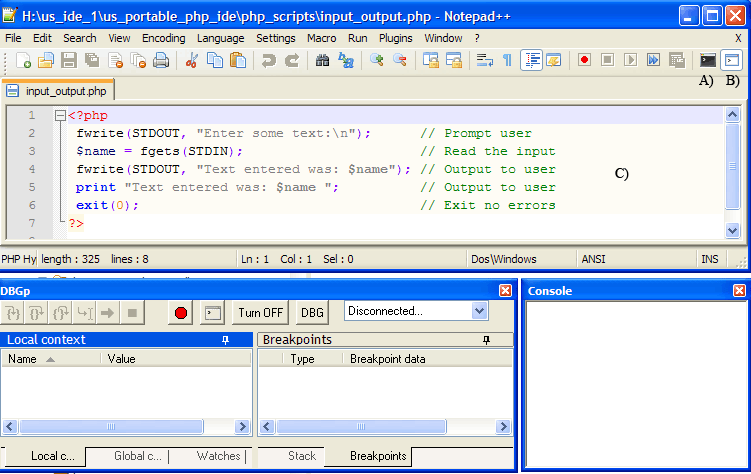
Open script, debug and console window
- Start Notepad++ run Run_IDE.bat.
- A) Click debugger icon displays debugger window
- B) Click console icon displays console window
- C) Open script to be debugged input_output.php
Always perform a syntax check on new scripts or after modifying a script.
- Right click in edit window c) from the context menu select Check PHP Syntax
- Alternatively Macro > Check PHP Syntax
Results of syntax check are displayed in the console window. Double clicking on any highlighted errors scrolls the edit window and highlights corresponding line in error.
|

|
Top
Start a debugging session
- Right click in edit window c) from the context menu select Run PHP CLI Debug
- Alternatively Macro > Run PHP CLI Debug
Note: If alerted by your firewall “e.g. CLI is trying to access the Internet” always allow access.
- Notepad++ icon flashes indicating debugging has started.
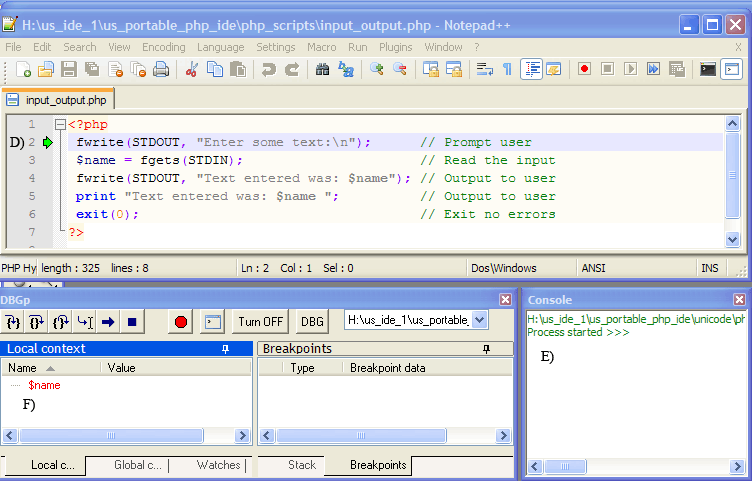
- D) The IDE is configured with a default break-point (breaks on first line of code). Green arrow displays current position of debugger.
- E) Console window displays "Process started" The script was effectively started from this window using a command script. Script input and output are directed to this window.
- F) Local context tab displays variables. We are using a single variable $name this is currently undefined (no value set)
|

|
Top
Request user input
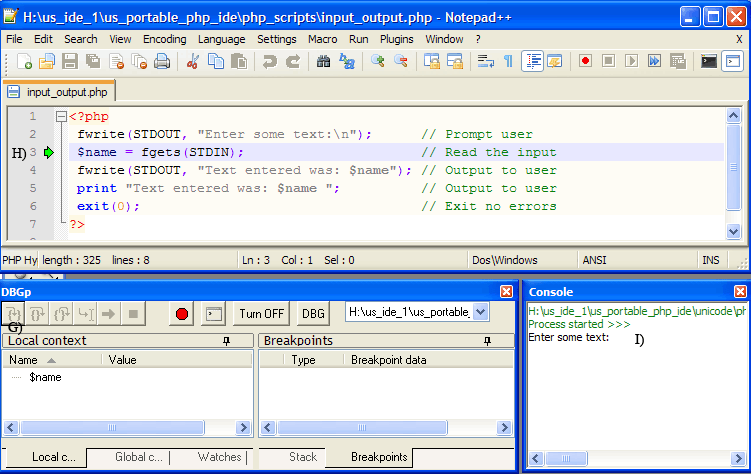
- G) Step into button. This allows you to single step through your script.
- G) Click once, steps to line 3 (it point to the line to be executed)
- G) Click again. Line 3 is executed. (Top row of debug buttons become disabled)
Note 1:
Debug buttons disabled control is passed to console window. This window is waiting for user input.
Note 2:
Variable $name remains undefined.
Note 3:
Function fwrite() has written string "Enter some text:\n" to standard output STDOUT
|

|
Top
Get user input
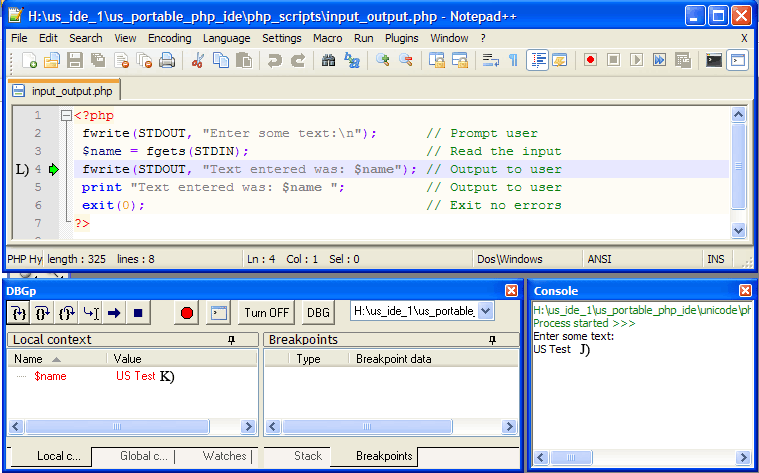
- J) Enter some text "US Test" and press enter.
- Script (function fgets(STDIN)) reads this line and control is returned to debugger.
- K) Variable $name becomes defined and set to the value entered US Test
- Note: All debugging controls are enabled
- L) Green arrow automatically steps on to the next instruction to be executed.
|

|
Top
Write to console
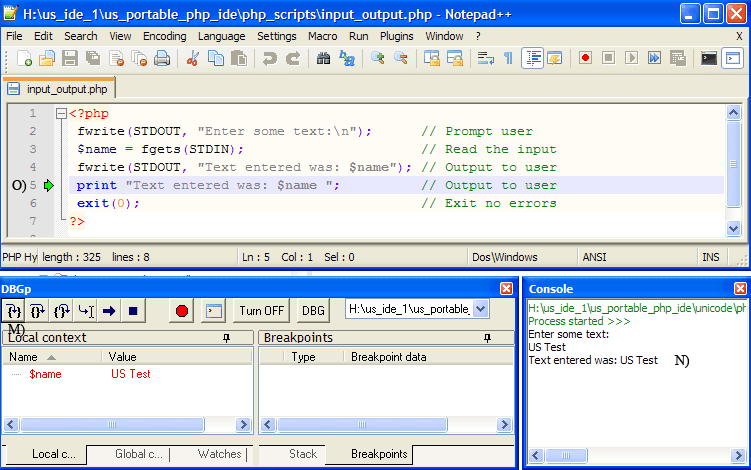
- M) Go into. Click this to execute function fwrite().
- N) Text and variable $name is written to console window.
- O) Green arrow automatically steps on to the next instruction to be executed.
|

|
Top
Write to console alternative
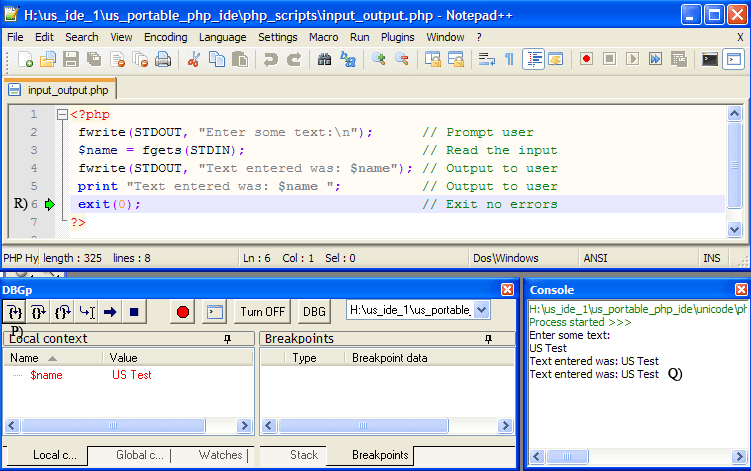
- P) Go into. Click this to execute print.
- Q) Text and variable $name is written to console window.
- R) Green arrow automatically steps on to the next instruction to be executed.
Note:
Line 5 was included to show print can be used as an alternative to the fwrite(STDOUT, "") function
|

|
Top
Final step
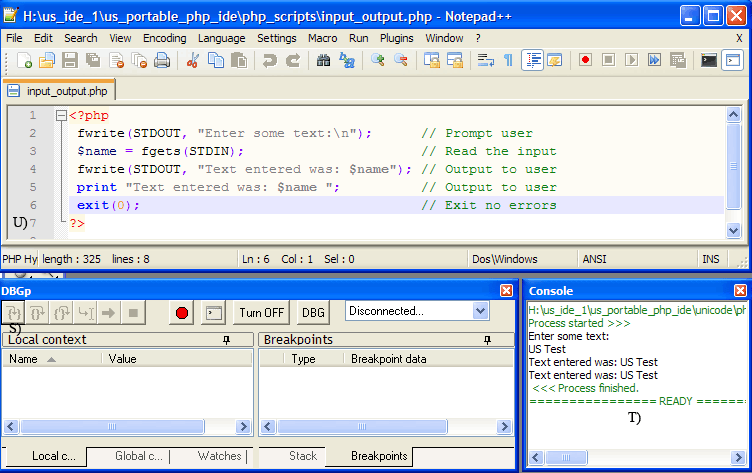
- S) Go into. Click this to execute final instruction in script.
- Debugging command menu options disabled.
- T) Console displays "Process finished".
- U) Green arrow automatically steps on to end of script. There are no more instructions to execute.
|

|
Top
Summary
Words and images can only provide a starting point hence fire-up the IDE and give it a workout.
The above has shown how to debug CLI scripts that use standard I/O.
Our IDE is capable of debugging PHP scripts that interface to the Windows API for example written using the WinBinder module.
Next page looks techniques for debugging a WinBinder application.
Top
