Uniform Server PHP IDE: XDebug Overview
|
Uniform Server PHP IDE : Introduction | XDebug Overview | IDE Overview | PHP CLI | XDebug WinBinder
|
|
| Uniform Server PHP IDE. |
XDebug Overview
XDebug is a main building block of the Uniform Server PHP IDE. XDebug along with Notepad++’s debugging client provides debugging capabilities for both CLI scripts and Web Page scripts.
XDebug’s versatility allows it to run on a server or from a command line. The debugging architecture differs slightly and this page provides an overview of these different architectures.
PHP CLI Debugging
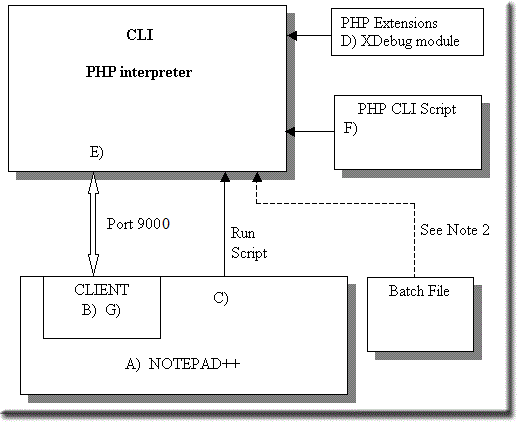
Debugging a PHP CLI script requires control of the PHP interpreter and a mechanism to separate script flow and error messages generated. A debugging client must provide unobtrusive communication with the interpreter while allowing a script to run.
The PHP extension php_xdebug.dll seamlessly installs code to provide interpreter control and communication between a client (Notepad++ with DBGp plugin installed in the IDE) and the PHP interpreter over port 9000. Effectively php_xdebug.dll includes a mini server to provide communication with a client.
|
Sequence of events
Note 2: If the script is initiated from an external source (for example, a batch file), XDebug determines if the script (F) is displayed in Notepad++. If not, it is downloaded.
|
Web Page Debugging
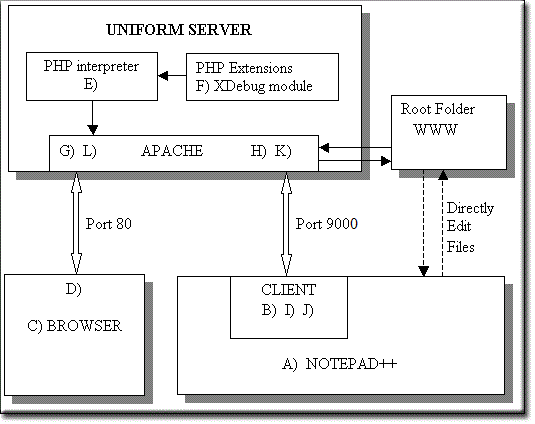
Debugging a website running on a local server effectively requires a second server and client. This second server and client taps into the primary server and web site to provide debugging and control of that site and server.
The second server is created using a PHP extension (php_xdebug.dll). It seamlessly installs code to provide communication between Apache and a client (Notepad++ with DBGpplugin installed) over port 9000. In addition, code is installed to monitor browser requests arriving on the standard Apache port 80.
|
Sequence of events Assumes Uniform Server running (Apache server running).
|
Note 1: Debugging is initiated from a browser. XDebug determines if the page is displayed in Notepad++ and if not, it is downloaded.
Note 2: If XDebug starts debugging a new page, that page is downloaded if not already displayed in Notepad++.
Note 3: During debugging, the browser shows page loading
Note 4: After step A) you can directly load, edit and save the page to be debugged. After enabling the debug client at step B) you can set break points and then imitate a debug session via the browser, Step C. The next page covers this in more detail.
Summary
The above block diagrams show the commonality between the two architectures, which are essentially the same. Each uses Notepadd++’s client plugin for debugging. This is covered in detail on the next page.

