Uniform Server PHP IDE: XDebug WinBinder
|
Uniform Server PHP IDE : Introduction | XDebug Overview | IDE Overview | PHP CLI | XDebug WinBinder
|
|
| Uniform Server PHP IDE. |
How to XDebug WinBinder
WinBinder is an open source extension for PHP allowing you to easily build Windows applications. A WinBinder application is essentially a PHP CLI script and therefore is debuggable using XDebug and a suitable client.
Our PHP IDE (Notepad++, DBGp client and console) has the capability of debugging a WinBinder application. On the IDE Overview page I mentioned on occasions you need to use a real command window this is such a scenario. A WinBinder application needs to be detached from the IDE hence the internal console cannot be used.
This page looks at debugging a simple window application created using WinBinder.
Note: Assumes you have installed Uniform Server PHP IDE portable.
Preliminary
Location of test files
- H:\us_ide_1\us_portable_php_ide\php_scripts\winbinder_example.phpw – Test script
- H:\us_ide_1\us_portable_php_ide\php_scripts\winbinder_no_debug.bat – Runs test script
- H:\us_ide_1\us_portable_php_ide\php_scripts\winbinder_debug.bat – Runs test script
- H:\us_ide_1\us_portable_php_ide\php_scripts\winbinder\include – WinBinder include files
Note: Your paths will be different substitute as appropriate.
Disable default break point
|
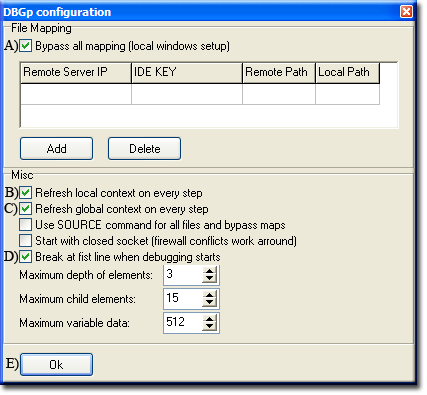
Debugging a WinBinder script requires disabling the default break-point in client configuration as follows:
|
WinBinder test script
|
Test script winbinder_example.phpw creates a window with two buttons. They both produce an alert box displaying different information. Script contains a break point function xdebug_break() currently commented out. We will enable this later to debug function test() |
<?php
include "winbinder/include/winbinder.php";  // Location of WinBinder library
$mainwin = wb_create_window(NULL, AppWindow, "US Test",WBC_CENTER, WBC_CENTER, 320, 240, WBC_TOP);
wb_create_control($mainwin, PushButton, "Button 1",  50, 70, 80, 22,     101);
wb_create_control($mainwin, PushButton, "Button 2", 180, 70, 80, 22,     102);
wb_set_handler($mainwin, "process_main");
wb_main_loop();
function process_main($window, $id) {
 switch($id) {
   case 101:
// xdebug_break();
     test($window,$id);
     break;
   case 102:
     wb_message_box($window, "Button #$id was pressed.");
     break;
   case IDCLOSE:                  // The constant IDCLOSE is predefined
     wb_destroy_window($window);  // Destroy the window
     break;
 }
}
function test($window,$id){
 $a= 10;
 $b= 20;
 $c= $a + $b;
   wb_message_box($window, "Button #$id was pressed \n Result = $c.");
}
?>
|
Batch Files
There are two batch files:
winbinder_no_debug.batRuns test script with no debugging. Demonstrates what the application does. Quick check: Double click on winbinder_no_debug.bat runs test script. Click both buttons an alert box pops-up. Close these and then the main window. |
mode con:cols=65 lines=20 TITLE UNIFORM SERVER - Winbinder No Debug COLOR B0 @echo off cls ..\unicode\php\php.exe -c ..\unicode\php\php_cli_ide.ini winbinder_example.phpw pause |
winbinder_debug.batThis uses a PHP configuration that loads XDebug for debugging test script. Quick check: Double click on winbinder_debug.bat runs test script. Notepad++ icon flashes. Click both buttons an alert box pops-up. Close these and then the main window. |
mode con:cols=65 lines=20 TITLE UNIFORM SERVER - Winbinder With Debug COLOR B0 @echo off cls ..\unicode\php\php.exe -c ..\unicode\php\php_cli_ide_debug.ini winbinder_example.phpw pause |
Although communication is established between XDebug and client no debugging takes place. To enable debugging at least one break-point must be set.
Set break-point and Debug
Enable break-point
Debug
|
<?php
include "winbinder/include/winbinder.php";  // Location of WinBinder library
$mainwin = wb_create_window(NULL, AppWindow, "US Test",WBC_CENTER, WBC_CENTER,
 320, 240, WBC_TOP);
wb_create_control($mainwin, PushButton, "Button 1",  50, 70, 80, 22,     101);
wb_create_control($mainwin, PushButton, "Button 2", 180, 70, 80, 22,     102);
wb_set_handler($mainwin, "process_main");
wb_main_loop();
function process_main($window, $id) {
 switch($id) {
   case 101:
  xdebug_break();
     test($window,$id);
     break;
   case 102:
     wb_message_box($window, "Button #$id was pressed.");
     break;
   case IDCLOSE:                  // The constant IDCLOSE is predefined
     wb_destroy_window($window);  // Destroy the window
     break;
 }
}
function test($window,$id){
 $a= 10;
 $b= 20;
 $c= $a + $b;
   wb_message_box($window, "Button #$id was pressed \n Result = $c.");
}
?>
|
Summary
That concludes this IDE introduction.
