PHP PORTABLE IDE: Notepad++ XDebug 1
|
US PHP IDE : Introduction | Notepad++ | Install PHP | NppExec Config | PHP extensions | Run Menu | XDebug 1 | Debugging 1 | XDebug 2 | Debugging 2
|
|
| Uniform Server Portable PHP IDE. |
Notepad++ XDebug
Our portable PHP IDE is currently lacking debugging capabilities. This page addresses that by providing a step-by-step guide for installing and setting up XDebug and Notepad++. It covers only PHP CLI debugging if you are looking for server-side PHP debugging check out page XDebug 2.
One of the advantages of running PHP in command line mode is that it does not require a server such as Apache for executing PHP scripts.
The guide is split across two pages; first covers installation while second provides basic CLI debugging techniques using Notepad++ DBGP Plugin (already installed).
Overview
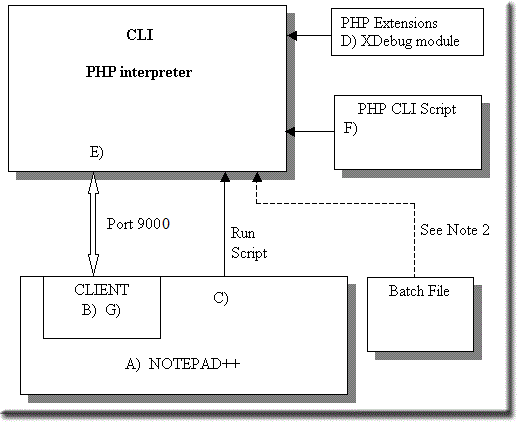
Debugging a PHP CLI script requires control of the PHP interpreter and a mechanism to separate script flow and error messages generated. A debugging client must provide unobtrusive communication with the interpreter while allowing a script to run.
The PHP extension php_xdebug.dll seamlessly installs code to provide interpreter control and communication between a client (Notepad++ with DBGp plugin installed) and the PHP interpreter over port 9000. Effectively php_xdebug.dll includes a mini server to provide communication with a client.
|
Sequence of events
|
XDebug download and install
Xdebug is the extension for PHP that helps debugging PHP scripts by providing debug information for details see XDebug website.
Windows binaries are located on this download page
Although our IDE uses VC9 thread-safe binaries its worth downloading both VC6 and VC9 binaries.
- Download XDebug 5.3 VC6 (32 bit) (php_xdebug-2.1.0-5.3-vc6.dll) and 5.3 VC9 (32 bit) (php_xdebug-2.1.0-5.3-vc9.dll)
- Save to folder C:\us_portable_ide_temp - Any temporary folder will do
Install
Install 5.3 VC9 (32 bit) binaries to our IDE
- Copy file C:\us_portable_ide_temp\php_xdebug-2.1.0-5.3-vc9.dll
- To folder C:\us_portable_ide\unicode\php\extensions
PHP Configuration file
Our IDE for debugging will use a separate PHP configuration file.
php_cli_ide_debug.ini
Create a new file php_cli_ide_debug.ini with the following content and save to folder C:\us_portable_ide\unicode\php
[PHP] ;extension=php_curl.dll ;extension=php_mysql.dll ;extension=php_openssl.dll ;extension=php_winbinder.dll ;extension=php_gd2.dll extension_dir = "./extensions" ;error_reporting = E_ALL | E_STRICT error_reporting = E_ALL date.timezone = "Europe/London" short_open_tag = Off [xdebug] zend_extension=./extensions/php_xdebug-2.1.0-5.3-vc9.dll xdebug.remote_autostart=on xdebug.remote_enable=on xdebug.remote_host=127.0.0.1 xdebug.remote_port=9000 xdebug.remote_handler=dbgp xdebug.remote_mode=req xdebug.idekey=default |
|
Section [xdebug] parameters
|
xdebug.remote_autostart=on |
Default value: 0 (off) Normally you need to use a specific HTTP GET/POST variable to start remote debugging. When this setting is set to 1 (on), Xdebug will always attempt to start a remote debugging session and try to connect to a client, even if the GET/POST/COOKIE variable was not present. |
|
xdebug.remote_enable=on |
Default value: 0 (off) This switch controls whether Xdebug should try to contact a debug client which is listening on the host and port as set with the settings xdebug.remote_host and xdebug.remote_port. If a connection can not be established the script will just continue as if this setting was 0. |
|
xdebug.remote_host=127.0.0.1 |
Default value: localhost Selects the host where the debug client is running. Use a host name or an IP address. This setting is ignored if xdebug.remote_connect_back is enabled. |
|
xdebug.remote_port=9000 |
Default value: 9000 The port to which Xdebug tries to connect on the remote host. Port 9000 is the default. Many clients use this port number, it is best to leave this setting unchanged. |
|
xdebug.remote_handler=dbgp |
Default value: dbgp The DBGp protocol is supported by Notepad++ client. |
|
xdebug.remote_mode=req |
Default value: req Xdebug will try to connect to the debug client as soon as the script starts. |
|
xdebug.idekey=default |
Default value: *complex* Controls which IDE Key Xdebug should pass on to the DBGp debugger handler. The default is based on environment settings. First the environment setting DBGP_IDEKEY is consulted, then USER and as last USERNAME. The default is set to the first environment variable that is found. If none could be found the setting has as default . |
Note:
The following function is useful for debugging
- xdebug_break() it emits a break-point to the debug client.
Add the function to your script it makes the debugger break on the specific line as if a normal file/line break-point was set on this line. This function is covered on next page.
Notepad++ DBGp client configuration
|
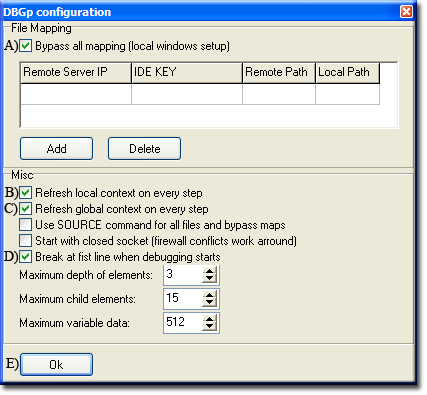
Configuring the DBGp client is straight forward. Steps shown below:
Note 1: We are running all our applications (Notepad++ PHP CLI Uniform Server) on the same system (will not be debugging remotely, over a network) hence at step A) check Bypass all mapping (local windows setup) box. Note 2: Step D) Break at first line when debugging starts is optional. If unchecked you must manually set at least one break point in your script. |
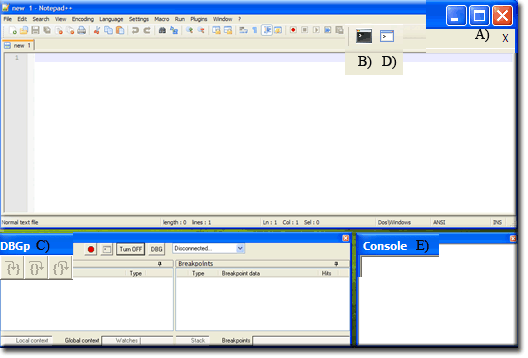
Docking Problem
There is a minor problem when opening both console and debugging windows. These are initially docked and overlap each other preventing access to tabs on the debugging window.
Solution
Closing Notepadd++ saves these new windows positions. Next time Notepad++ is run console and debugging widows remain un-docked. |
Test Configuration
XDebug
Into a console window type the following: $(NPP_DIRECTORY)\php\php.exe -c $(NPP_DIRECTORY)\php\php_cli_ide_debug.ini -v
Check Xdebug has been loaded. Result similar to the following:
$(NPP_DIRECTORY)\php\php.exe -c $(NPP_DIRECTORY)\php\php_cli_ide_debug.ini -v
C:\us_portable_ide\unicode\php\php.exe -c C:\us_portable_ide\unicode\php\php_cli_ide_debug.ini -v
Process started >>>
PHP 5.3.3 (cli) (built: Jul 21 2010 20:28:30)
Copyright (c) 1997-2010 The PHP Group
Zend Engine v2.3.0, Copyright (c) 1998-2010 Zend Technologies
    with Xdebug v2.1.0, Copyright (c) 2002-2010, by Derick Rethans <----- Confirms Xdebug loaded
<<< Process finished.
================ READY ================
New NppExec script
For a quick refresher view the following Add new NppExec command script
Add new NppExec command script
Add the new script as follows:
|
Add new command script
NPP_SAVE
cls
$(NPP_DIRECTORY)\php\php.exe -c $(NPP_DIRECTORY)\php\php_cli_ide_debug.ini $(FULL_CURRENT_PATH)
Opens Script name side window:
Note: With no script open following message is produced C:\us_portable_ide\unicode\php\php.exe -c C:\us_portable_ide\unicode\php\php_cli_ide_debug.ini new 1 Process started >>> Could not open input file: new <<< Process finished. ================ READY ================ |
The following assigns our command script to menu items.
Note 1: Check new menu items added to macro drop-down menu as shown below. |
The above allows you to perform debugging on a CLI script displayed in Notepad++.
Summary
Above has shown how to configure our PHP IDE for debugging CLI scripts.
Debugging PHP CLI scripts is relatively easy or should I say the actual steps are see next page for details!


