PHP PORTABLE IDE: Notepad++ Debugging 1
|
US PHP IDE : Introduction | Notepad++ | Install PHP | NppExec Config | PHP extensions | Run Menu | XDebug 1 | Debugging 1 | XDebug 2 | Debugging 2
|
|
| Uniform Server Portable PHP IDE. |
Notepad++ Debugging 1
At this stage we have a fully functional PHP CLI IDE for debugging scripts. It is self-contained with its own PHP interpreter and is portable allowing it to be run from a USB memory stick.
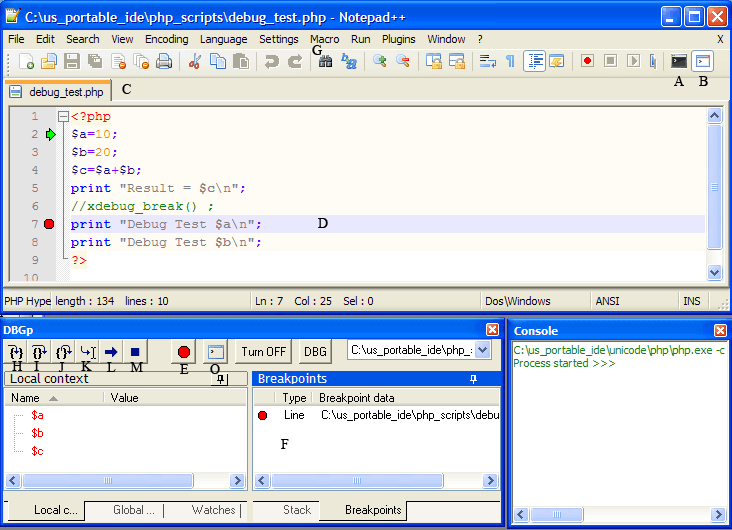
This page provides a quick introduction to the BDGp user interface using a simple PHP CLI script.
Test Script
|
Script:
|
<?php $a=10; $b=20; $c=$a+$b; print "Result = $c\n"; //xdebug_break() ; print "Debug Test $a\n"; print "Debug Test $b\n"; ?> |
Debugging overview
At first sight the debugger looks intimidating however it really is easy to use. Start the IDE by running Run_IDE.bat located in folder <whatever path you used>/us_portable_ide.
Open test file debug_test.php in Notepad++ edit window and follow the instructions below to debug.
Note: Script output and errors are displayed in the cosole window |
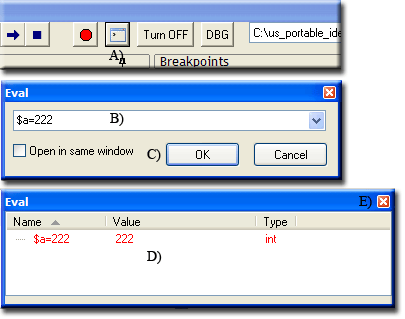
Change Value of a variable
After running up to a breakpoint and before continuing you may want to change a variable’s value.
Set a variable as follows
|
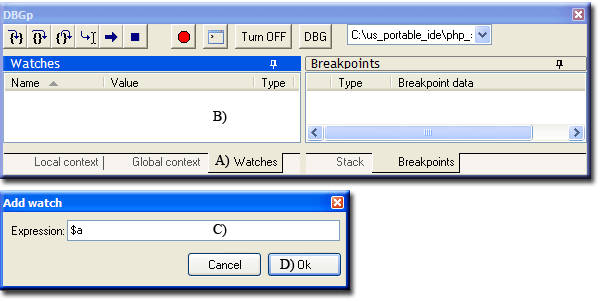
Watches
List of variables displayed in the Local Context may become large masking a variable you want to constantly monitor.
Ideally you want to directly monitor a few variables this is achieved by using the Watches window. Add variables as appropriate to this window.
Add Watch
Delete Watch
|
Xdebug Break function
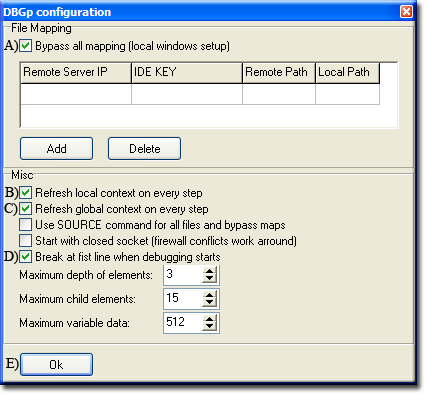
For debugging you must set at least one break point. Currently we have a default break point set when the debugger starts. This is set to break on first line of a script.
Generally this is suitable for most debugging applications however sometimes you want to start debugging in another page that is called from your main script.
Disable default break point
|
How to disable
Leave all other settings as they are Note 1: For debugging to take place either manually set a break point in a page |
Add xdebug_break() to a page
You can add the xdebug_break() to any location in a page and break at that point
|
For example
Note: No variables displayed in local context window. |
<?php $a=10; $b=20; $c=$a+$b; print "Result = $c\n"; xdebug_break() ; print "Debug Test $a\n"; print "Debug Test $b\n"; ?> |
Alternative Console Window
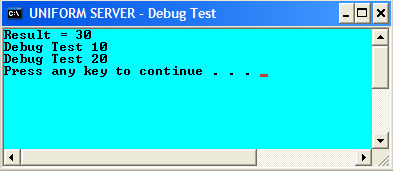
There are occasions when you want to use a real command window (console cmd) by running a batch file. This batch file in turn runs a PHP CLI script.
Batch file
|
mode con:cols=65 lines=20 TITLE UNIFORM SERVER - Debug Test COLOR B0 @echo off cls ..\unicode\php\php.exe -c ..\unicode\php\php_cli_ide_debug.ini debug_test.php pause |
Debug
The batch file runs our test script debug_test.php any output or input is directed to the batch file command window. The script can be debugged using Notepad++ while the internal console window is not used.
- Start Notepad++.
- Show debugger window (click its icon) No need to open test script.
|
Summary
Above has covered main features of the debugging window.
You can either use the integrated or an external command console window for displaying and inputting data to a CLI script.
Next page covers server side configuration for debugging WebPages.
